How Complex are TodoMVC Implementations
Controlling complexity is the essence of computer programming. - Brian Kernighan
One promise application frameworks have in common is to reduce the amount of work necessary to get things done. Not having to re-invent the wheel for every new project and being able to rely on a library of functions that perform common tasks certainly has its benefits.
When doing Web or mobile development it is almost impossible these days not to consider working with a JavaScript framework or library. But there are plenty of them and a new one seems to pop up every day.
A good place to start looking for a framework/library is the TodoMVC project, which is a collection of implementations of a simple Todo app. Each implementation either uses one of the more popular MVC frameworks (AngularJS, Ember.js, Backbone.js etc.), or a library (Closure, Dojo, jQuery) or no external dependencies like the Vanilla JS example.
I skimmed the source code of some of the Todo app implementations and thought about ways to measure them and make them comparable. One thing that immediately came to my mind was using cloc to count the lines of code, in the end I expect to write less code when using a framework. But this metric alone doesn't tell how complex the code is.
Fortunately, there is complexityReport.js, a tool for reporting code complexity metrics in JavaScript projects, which currently reports on: lines of code, number of parameters, cyclomatic complexity, Halstead metrics, and Maintainability Index. I used this tool to create complexity reports for the TodoMVC implementations, aggregated the numbers on a per project bases and created bar graphs for easier comparison of the example apps.
Complexity of Todo App Implementations
Below you find information on the different metrics that were calculated and the graphs comparing the different projects. Only JavaScript source files are considered in these numbers and external libraries were excluded. The gwt and dart examples were completely omitted as they are not written in JavaScript.
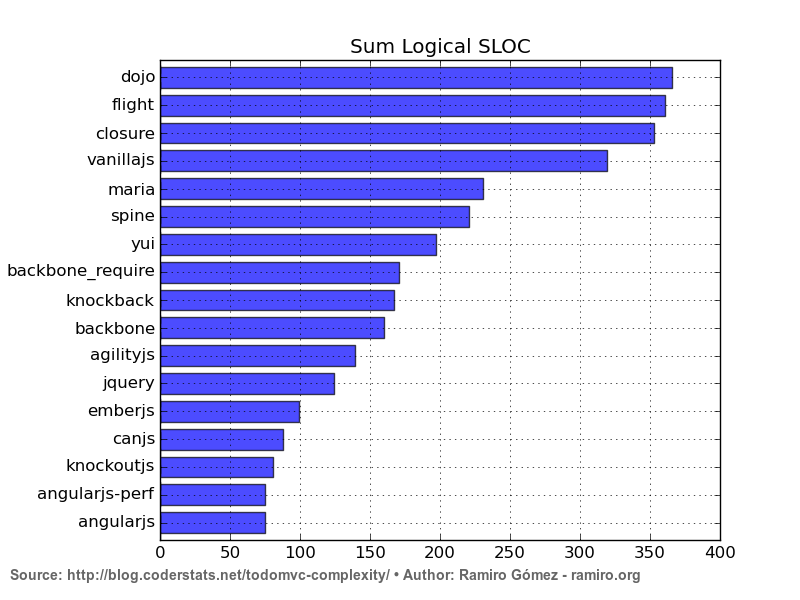
Source Lines of Code (SLOC)
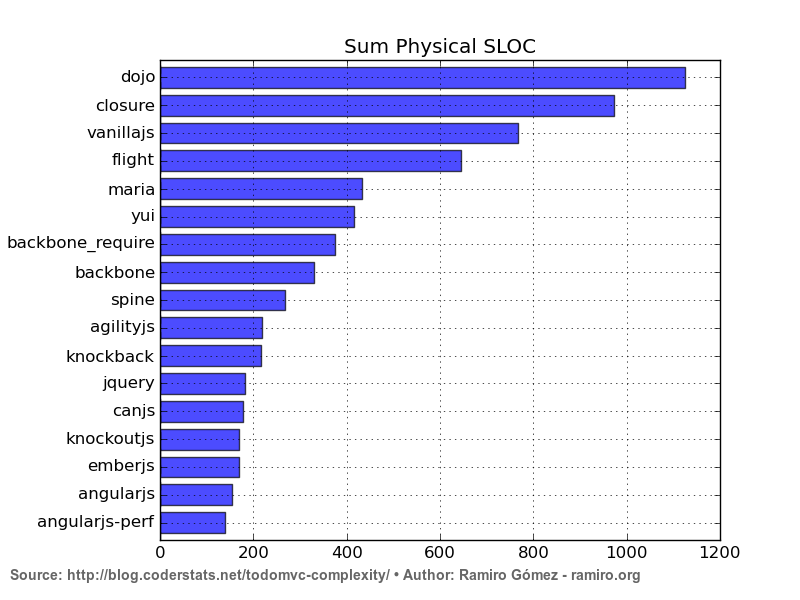
This metric is divided into physical (actual lines) and logical (imperative statements) counts. Both are not very informative regarding complexity, but I still think the logical lines of code is an interesting metric to look at.
SLOC Logical
SLOC Physical
The logical lines of code range from 75 for AngularJS to 366 for Dojo. Quite a difference and quite impressive how few lines of code you need with some of the frameworks. Interestingly, the Vanilla JS implementation was written in less lines of code than the Dojo, Flight, and Closure examples. Considering that laziness is a virtue for programmers AngularJS certainly looks more attractive than Dojo here.
Cyclomatic complexity
The Cyclomatic complexity is a metric developed by Thomas J. McCabe in 1976. It measures the complexity of a program by counting the number of linearly independent paths through a program's source code. The lower the cyclomatic complexity the better. McCabe suggested that programmers should split a software module into smaller parts whenever the cyclomatic complexity of the module exceeded 10. You can read the original paper here.
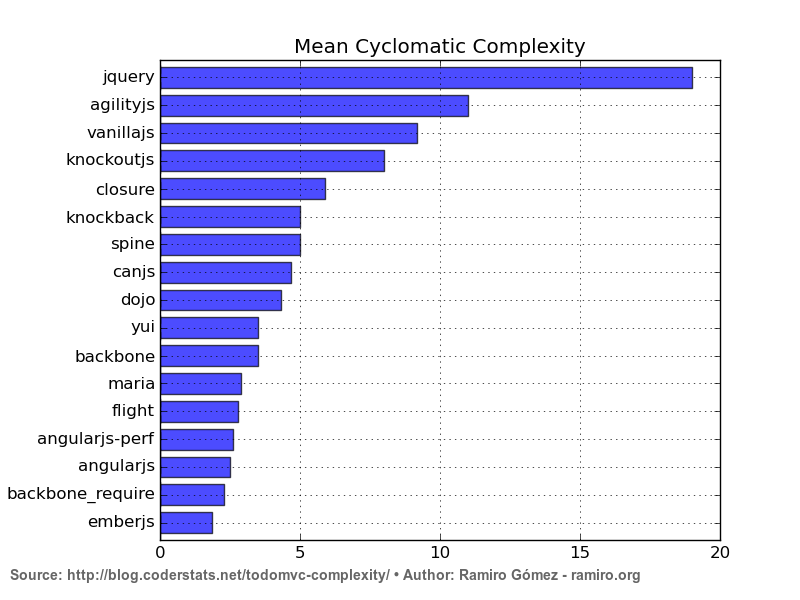
The mean cyclomatic complexity was calculated by dividing the sum of the aggregate complexity values for all files (modules) by the number of files.
jQuery stands out here. One factor being that the whole app is written in a single file with the outer anonymous function having a cyclomatic complexity of 183. KnockoutJS, however, is also a single-file implementation and has a much lower value.
Besides jQuery, Agility.js exceeds the threshold of 10, all others fall below it with Ember.js scoring best with just 2.
Halstead complexity measures
These measures introduced by Maurice Howard Halstead in 1977 are based on the number of distinct operators (n1), the number of distinct operands (n2), the total number of operators (N1) and the total number of operands (N2) in each function of a program module.
What you see in the graphs below are the totals aggregated from all JavaScript files per example application. For all of these Halstead measures lower values are better.
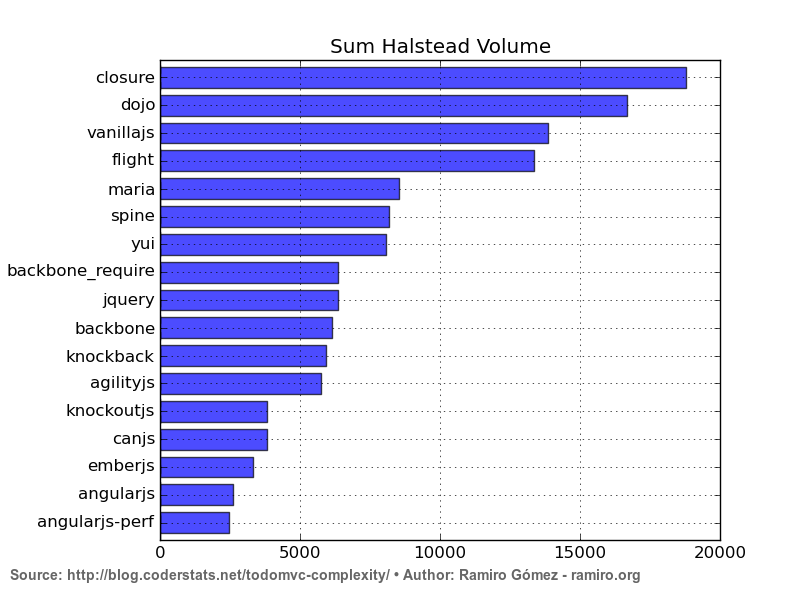
The program volume (V) measures the information contents of the program in mathematical bits.
Formula: V = (N1 + N2) * log2(n1 + n2)
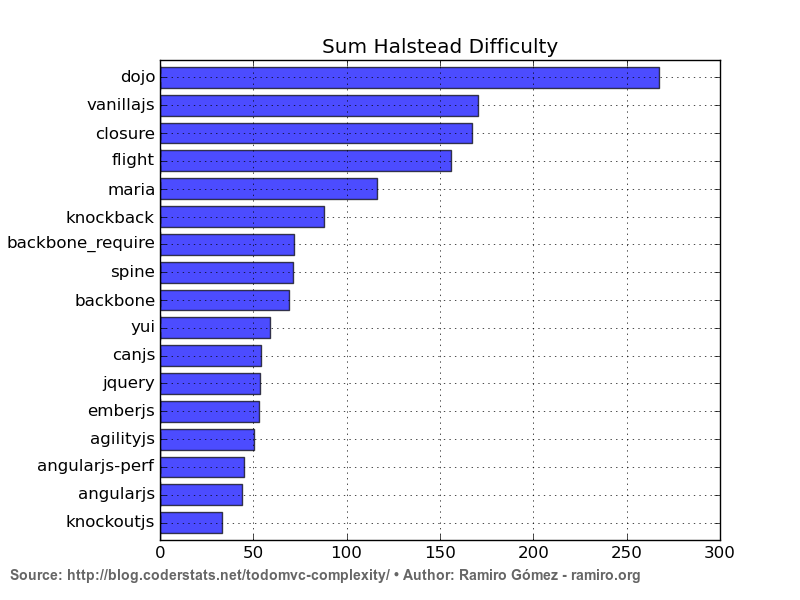
The difficulty or error proneness (D) is proportional to the number of unique operators and to the ratio of total number of operands and the number of unique operands. So using the same operands frequently throughout a program makes it more prone to errors.
Formula: D = (n1 / 2) * (N2 / n2)
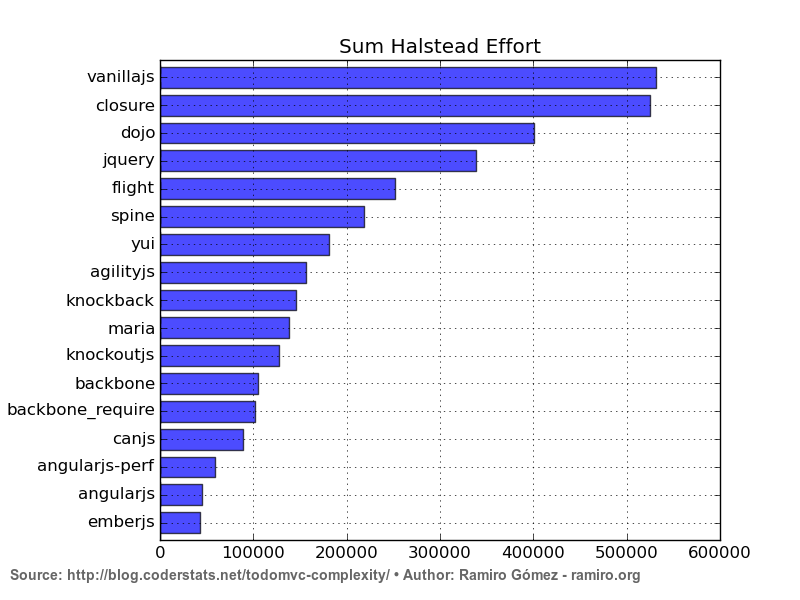
The effort (E) to implement or understand a program is the product of its volume and difficulty.
Formula: E = V * D
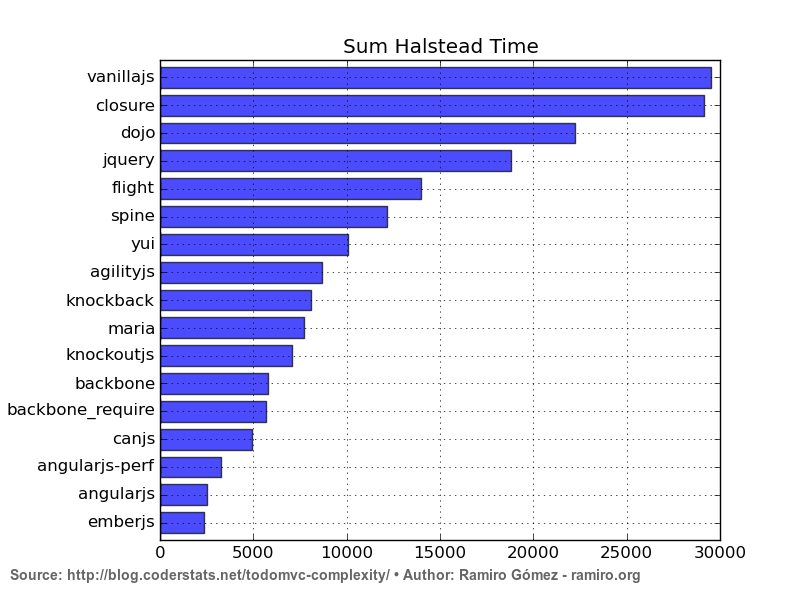
The time to implement or understand a program (T) is proportional to the effort. Halstead found by experimentation that dividing the effort by 18 gives an approximation for the time in seconds.
Formula: T = E / 18
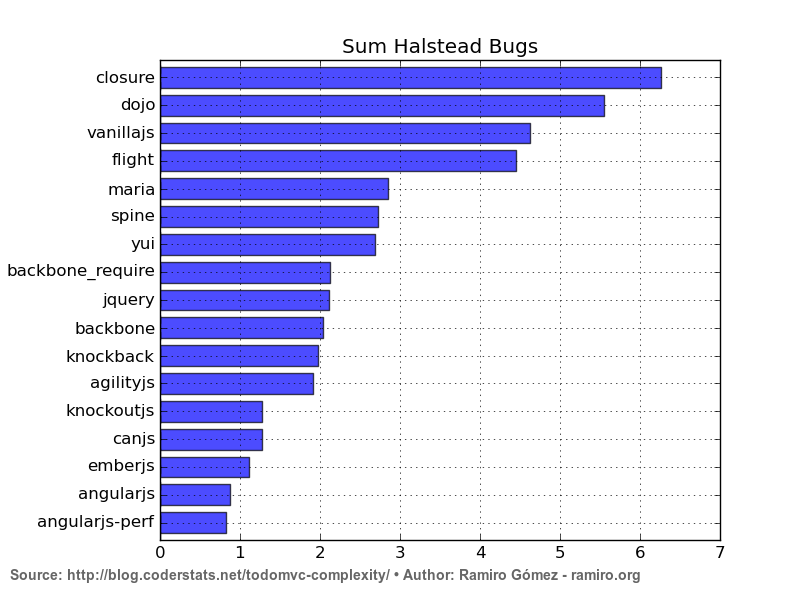
This measure is an estimate of the number of delivered bugs (B). It correlates with the overall complexity of the program.
Formula: B = (E**(2 / 3)) / 3000
The differences between lower and higher values are quite dramatic for all of these Halstead measures. Picking the time for example the Ember.js implementation would take roughly 40 minutes and the Vanilla JS implementation about 8 hours, provided you have a similar level of experience. These values don't seem too far off when looking at the actual code.
Maintainability Index
The Maintainability Index takes into account 3 of the metrics we saw before and combines them into one formula:
MI = 171 - (3.42 * ln(mean effort)) - (0.23 * ln(mean cyclomatic complexity)) - (16.2 * ln(mean logical SLOC))
This metric was designed in 1991 by Paul Oman and Jack Hagemeister. Its values range from negative infinity up to 171 on a logarithmic scale. Higher values indicate better maintainability. Oman and Hagemeister identified 65 as the threshold value below which a program is considered difficult to maintain.
The mean Maintainability Index was calculated by dividing the sum of Maintainability Index values across all files of a project by the number of files.
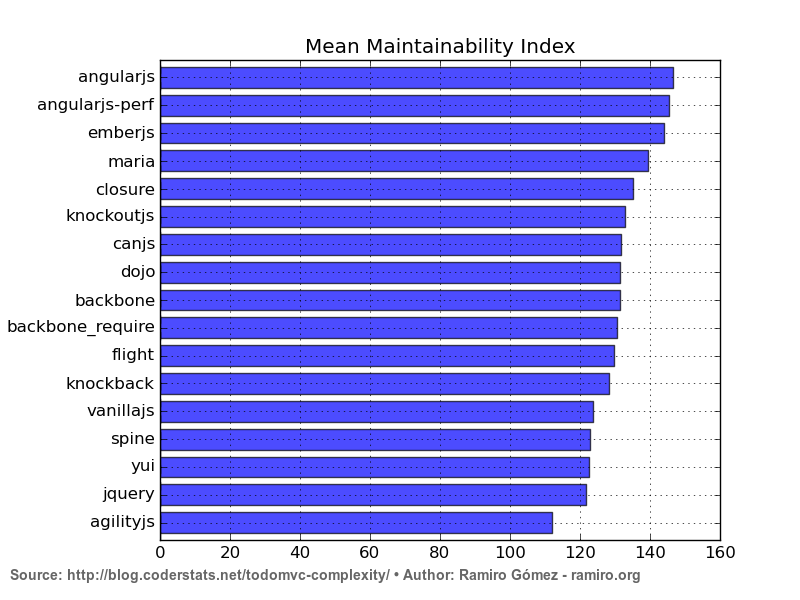
The Todo app is conceptually fairly simple and all of its implementations are rather small code projects so none of them falls below the threshold proposed by Oman and Hagemeister. Unsurprisingly, those Todo app implementations that scored well before (mostly on the lower end) are also more maintainable according to this metric.
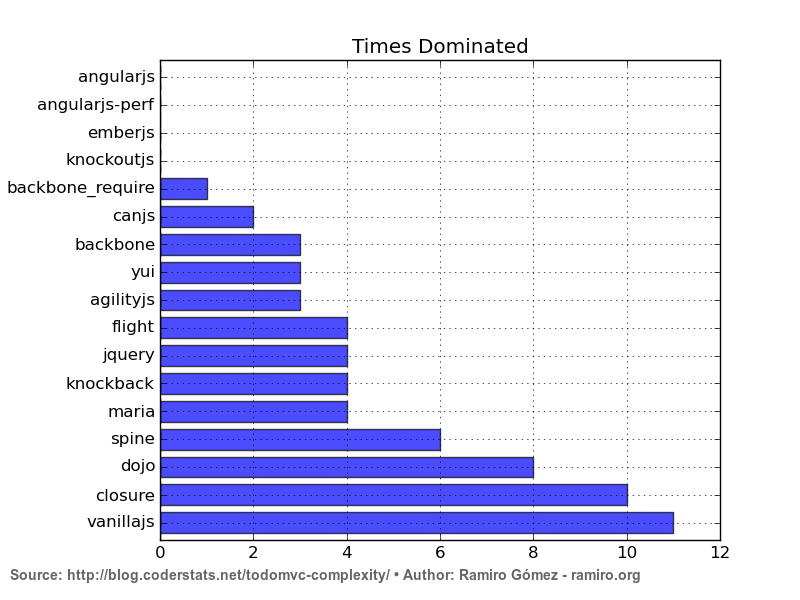
Domination Ranking
This section was added 3 days after the 1st publication.
There was some discussion on Reddit about this post and Redditor jpfed calculated a domination ranking based on the scores across all metrics.
In his formula he compared each pair of implementations (X, Y) saying that implementation X is dominated by implementation Y, if Y scores better than X on all metrics.
In other words the less often an implementation is dominated the better, which makes AngularJS, AngularJS-perf, Ember.js and KnockoutJS look pretty good.
Summary
In this article I compared 17 different JavaScript based implementations of a simple Todo list app using the metrics: lines of code, cyclomatic complexity, Halstead measures and Maintainability Index. Overall AngularJS and Ember.js scored pretty well. Dojo, Closure and Vanilla JS on the other end require more programming and maintenance effort.
As mentioned earlier the Todo list app is rather simple and all of the projects are fairly small in size. It would be interesting to compare a more complex type of application using these measures to see whether the different approaches would score similarly to the results presented here.
So without generalizing what these numbers say, they help me narrow down the potential choices in the ever-growing jungle of JavaScript MVC frameworks and libraries.
References
Featured Merch

Latest Posts
- Social Media Dimensions Cheat Sheet 2026
- How to Check if an IP Address is Blocked on Linux
- How to Inspect All Cron Jobs on a Linux System: A Sysadmin's Guide
- Building a 3D Elevation Photo Diary with deck.gl
- Thunderbird Keeps Threading Emails? Here's the Fix
Featured Book

Subscribe to RSS Feed
Published by Ramiro Gómez on . Subscribe to the Geeksta RSS feed to be informed about new posts.
Tags: todomvc visualization coderstats software development static analysis
Disclosure: External links on this website may contain affiliate IDs, which means that I earn a commission if you make a purchase using these links. This allows me to offer hopefully valuable content for free while keeping this website sustainable. For more information, please see the disclosure section on the about page.